
 [FOR-OFFICIAL-USE-ONLY]
RELEASED
BY Woomera Gamma Imaging
ARPANSA
Nuclear Stewardship
Authors:
Dr Mathew Guenette and Lachlan Chartier
UNDER
Date:
4/09/2018
Report Number: R180128
FOI
Approved By:
Dr Mark Reinhard
FEBRUARY
Technical
Reviewer:
Jennifer Harrison
Issued To:
Jen Baxter, CSIRO
2019
Date Issued:
21/09/2018
s 47F - privacy
Contact Details: Telephone
Email
ANSTO, New Illawarra Road, Lucas Heights (Locked Bag 2001, Kirrawee DC NSW 2232)
Page 1 of
22
www.ansto.gov.au
(T-6725 R3 Report Template Effective Date: 06/09/2018)
 [FOR-OFFICIAL-USE-ONLY]
Executive Summary
[FOR-OFFICIAL-USE-ONLY]
Executive Summary
ANSTO staff visited a CSIRO facility in Woomera, SA from 29/5/2018 until the 31/5/2018 to
conduct gamma imaging of a building annex containing ~10 000 drums of waste material. The
purpose of the trip
RELEASED was to non-invasively characterise the radiological status of the drums using
ANSTO developed gamma ray imaging technology.
Data analysis indicated the presence of 214Bi and 214Pb. Both of these radionuclides are gamma
emitting members of the 238U decay series. The 238U decay series radionuclides are often present in
naturally occurring radioactive material (NORM) and are found in all rocks and soils. Higher
radioactivity levels of 238U decay series radionuclides can be found in NORM such as uranium ore
or Technologically Enhanc
BY ed NORM (TENORM) such as waste streams from ore processing and
industrial processes. No other gamma emitting radionuclides were detected above local
background from the drums.
ARPANSA
Gamma image pairs, for both 214Bi and 214Pb, were generated at five locations which indicated that
214Bi and 214Pb were predominantly co-located in drums. Obtained images indicate that only a
select few first layer drums have elevated levels of radioactivity and that the majority contain
levels below the detection limits of the gamma ray imaging technology.
UNDER
Purpose
The objective of this work was to non-invasively characterise the radiological status of drums
stored at the Woomera site using ANSTO developed gamma ray imaging technology. Gamma
FOI
imaging identifies the location of drums with relative higher levels of radioactivity which will inform
future detailed characterisation campaigns.
FEBRUARY
Additional outcomes of this work are demonstration of the non-invasive gamma ray imaging
capability and operational insights of gamma imaging deployment at the Woomera site. This
includes investigating hardware and algorithmic modifications to the gamma imager for enhanced
characterisation, as well as identifying aspects of the broader Woomera project where imaging or
detection technology may be beneficial to the characterisation effort.
Method
2019
The ANSTO spectroscopic gamma-ray imaging system (‘Cyclops’) provides a passive and non-
invasive capability to locate and identify sources of gamma emitting radionuclides at distance. The
imaging system has a large field of view (360° x 90°), wide energy range (40 keV to 3000 keV)
and produces a combined optical/gamma-ray image for the visualisation of the radiation location.
The imaging system consists of a 1.5” CeBr3 Scionix scintillation detector located in the centre of
dual rotating, mask collimators. Gamma images are then created using any specified energy
Woomera Gamma Imaging
Page 2 of
22


 [FOR-OFFICIAL-USE-ONLY]
window of the recorded gamma spectrum using the signal processing theory of compressed
sensing (Compressed sensing, D.L. Donohue, IEEE Trans Inf. Theory 52 (2006), 1289-1306).
Non-destructive, radiological assessment of waste drums produced by the nuclear industry often
employs gamma scanning technology (e.g. segmented or tomographic scanning systems from
Canberra or Antech Inc.). However, this technology requires the movement and manual handling
of each drum, which potentially poses contamination/spill risks due to age and unknown condition
RELEASED
of the drums. Furthermore, a dedicated processing facility in close proximity to the drums would
be required which may not be feasible. The use of conventional radiation dose rate surveying
equipment to measure each drum also presents its own problem; the closely stacked, stationary
configuration of the drums means that dose rate measurements of particular drum will be affected
by radiation originating from the surrounding drums.
The use of gamma-ray imaging is valuable as a means of identifying hot spots of gamma-emitting
BY
radionuclides within the drums in their current configuration. In contrast to other methods,
compressive gamma-ray imaging can be undertaken at a distance which reduces the radiological
ARPANSA
exposure of workers and measures radiation from its source through a collimator, allowing the
location of the source to be determined. As a result, radiation sources from adjacent drums can be
resolved individually, based on the spatial resolution of the imaging system being utilised.
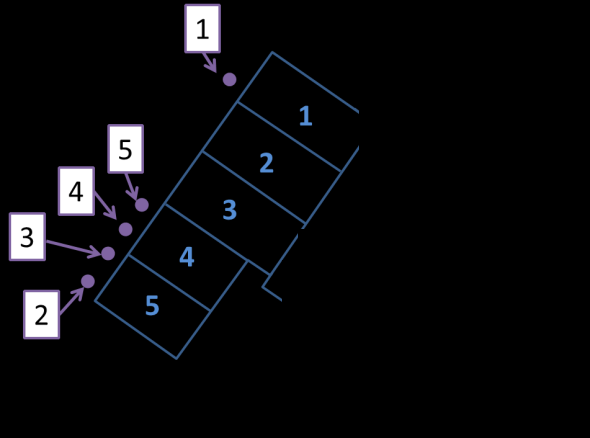
Gamma-ray imaging was undertaken at five locations outside the annex, shown in Figure 1. Image
location number is ordered chronologically by the time the images were acquired.s 33 - security
UNDER Figure 2 shows the deployed imaging
system at two measurement locations. Limited and confined access restricted imaging to the first
layer of drums only. It should be noted that neither the annex nor hangar were entered for this
activity.
FOI
FEBRUARY
s 33 - security
s 33 -
securit
y
s 33
s 33 - security
-
secur
s 33 - security
ity
2019
Figure 1: Image locations 1 – 5. Location numbers are shown in purple boxes and annex bay numbers are
indicated by the blue text.
Woomera Gamma Imaging
Page 3 of
22
 [FOR-OFFICIAL-USE-ONLY]
The choice of imaging location was informed by previously identified radiation hot spots from
‘ANSTO report R180057: Woomera Characterisation: Gamma Survey of Area 1, D. Boardman and
S. Hagan (2018)’. Descriptions of the imaging locations and approximate dose rates at the
detector are given in Table 1.
The dose rates at each of the imaging locations (Table 1) are considered low. For reference, the
average dose rate from background radiation in Australia is approximately 0.2 μSv/h (Exposure to
RELEASED
background radiation in Australia, S.B. Solomon, Australian Nuclear Association Inc; ANA'97:
Second conference on nuclear science and engineering, (1997) 102-106). Since dose rate is
proportional to radioactivity concentration it was anticipated that the gamma-ray images,
measured in counts, would need to be acquired for many hours. The mean Woomera temperature
at the site varied between ~10.7 °C (9 AM) and 17.1 °C (3 PM) during the days of the imaging
activity. Additional heating of the system occurred due to the deployment in the sun. Detector
energy calibration during the image acquisition was applied by using two energy calibration
BY
measurements at the start and end of each image using a small 232Th mantle source (exempt)
over the energy range 240 keV – 2600 keV.
ARPANSA
Table 1
Location
Description and Approximate Dose Rate at Detector
s 33 - security
UNDER
FOI
FEBRUARY
2019
Woomera Gamma Imaging
Page 4 of
22
 [FOR-OFFICIAL-USE-ONLY]
s 33 - security
RELEASED
BY ARPANSA
UNDER
FOI
FEBRUARY
2019
Figure 2: Photos of the Cyclops gamma imaging system deployed at Woomera; (Top) Location 2, (Bottom)
Location 5, as listed in Table 1.
Woomera Gamma Imaging
Page 5 of
22
 [FOR-OFFICIAL-USE-ONLY]
Gamma Spectroscopy
[FOR-OFFICIAL-USE-ONLY]
Gamma Spectroscopy
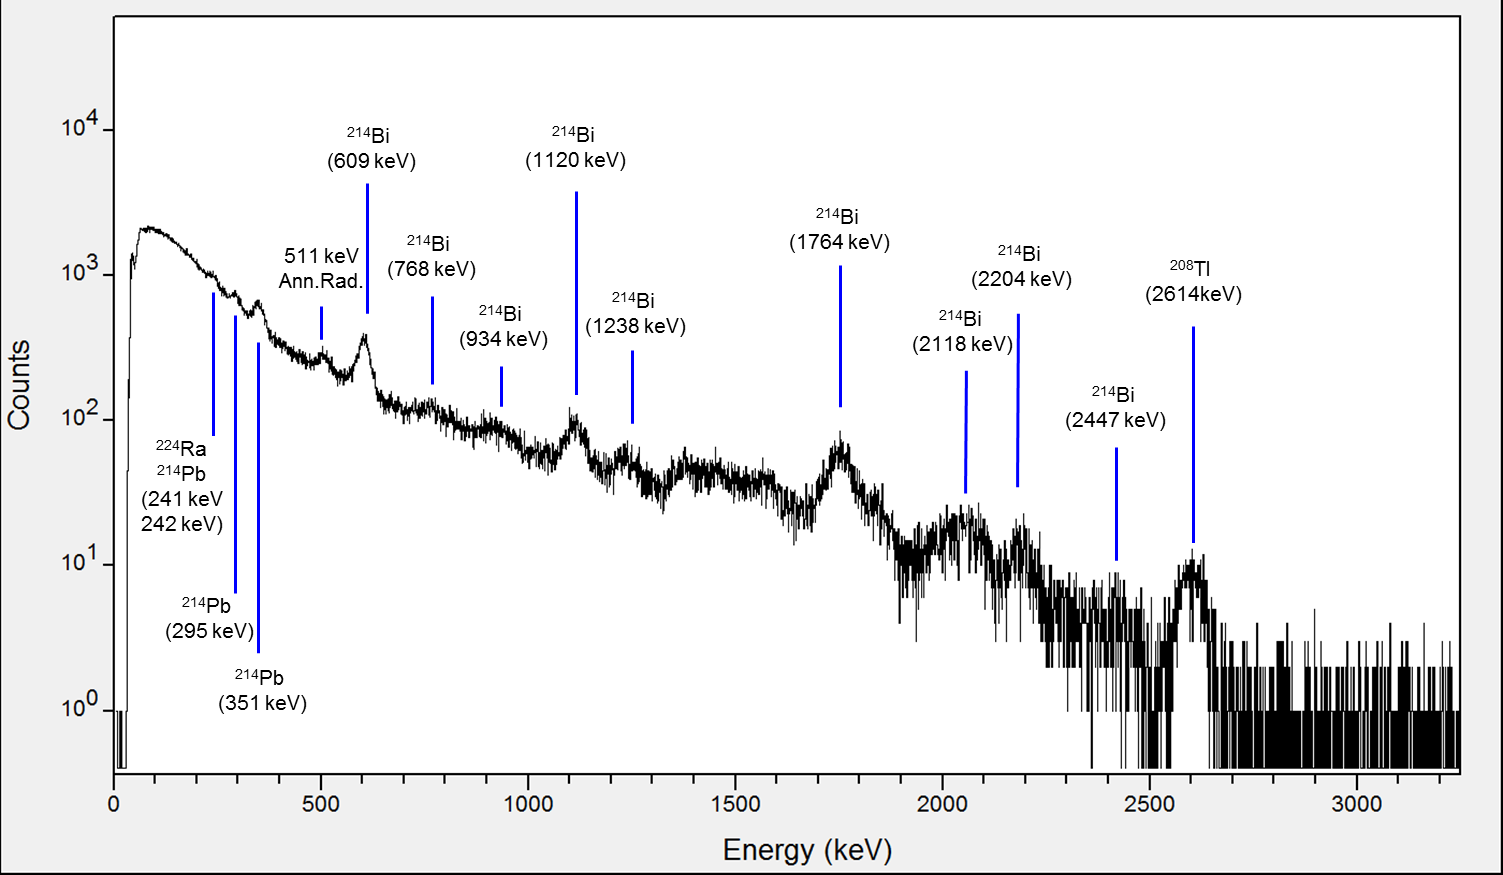
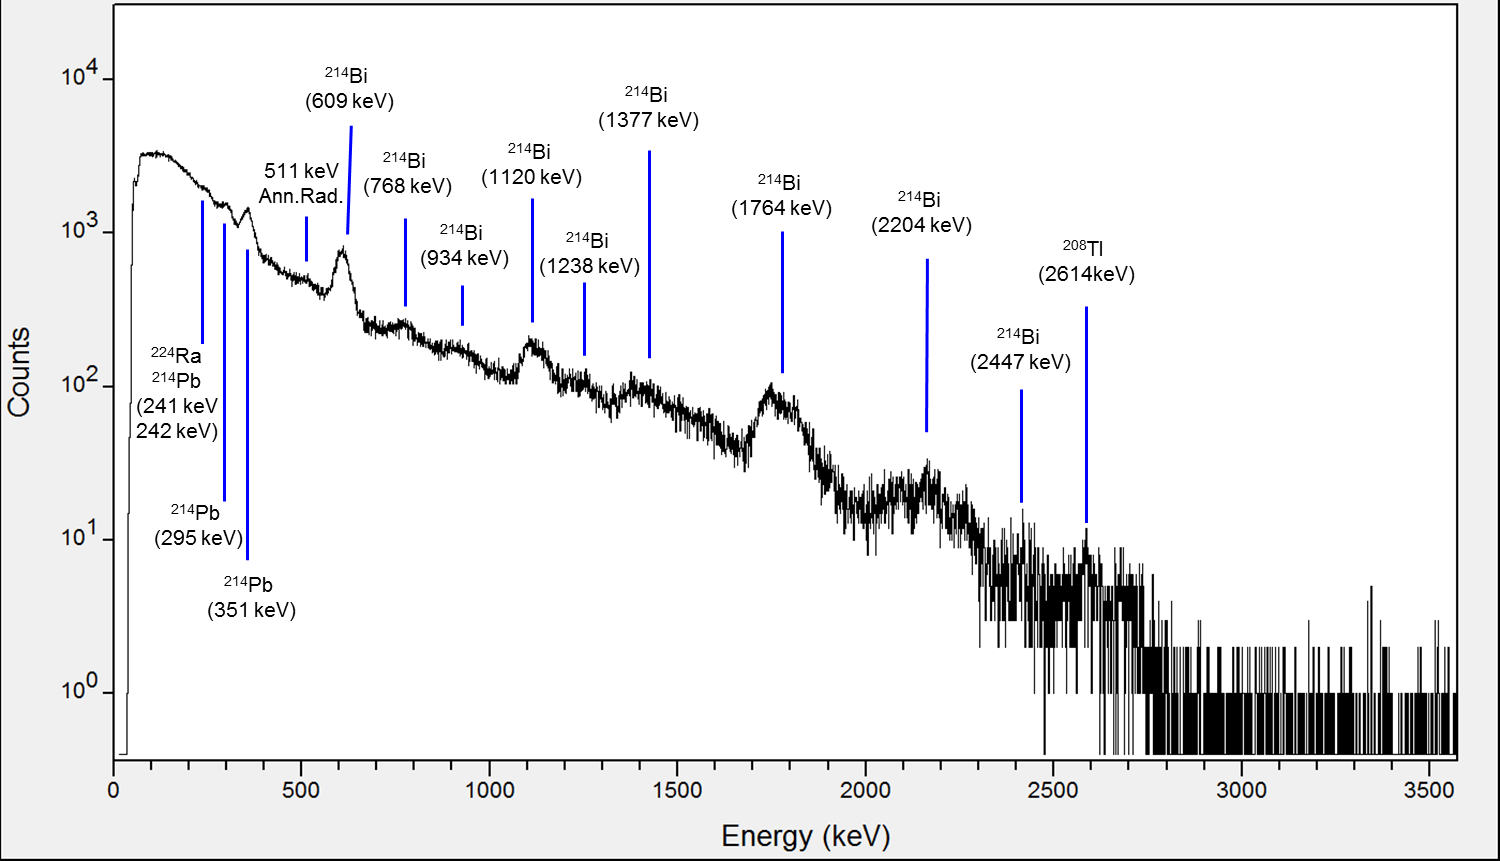
Figure 3 shows the gamma spectrum recorded at Location 3 (s 33 - security
Only one gamma
spectrum is shown here as the spectra at each location are similar and contain identical peak
information. For completeness, the gamma spectra from all locations are shown in Appendix A.
The spectra is domin
RELEASED ated by the 238U decay series daughters (214Bi and 214Pb), with the 232Th decay
series daughter (208Tl) also being present. In contrast, previous background gamma spectroscopy
measurements on the eastern side of the hangar and at the Eldo Hotel, two locations not impacted
by radioactivity from the drums, (see Figure A6 in Appendix A and ANSTO report R180057:
Woomera Characterisation: Gamma Survey of Area 1, D. Boardman and S. Hagan (2018)) show
that 214Bi (only at 619 keV), 40K and 208Tl are present. The relative count rates and spectral shape
of the two background spectra compared with the spectra acquired from locations 1-5 suggest that
at imaging locations 1-5:
BY
ARPANSA
1) 214Bi is well above background count rates
2) 214Pb is present
3) 40K is not observed
In addition, the gamma spectroscopy results from Boardman et al. show that the 208Tl peak at
2614 keV has similar count rates when measured near the drums and during background
measurements, suggesting that the 208Tl peak originates from loc
UNDER al background radiation.
Therefore, the presence of 214Bi and 214Pb are attributed to drums whilst 208Tl and 40K are
attributed to local background radiation originating from the soil.
FOI
The presence of 214Bi and 214Pb at locations 1-5 is indicative of some or all members of the 238U
decay series in higher activity concentrations than observed in local background measurements. In
the 238U decay series, 214Pb decays to 214Bi, and secular equilibrium would be achieved between
FEBRUARY
these radionuclides and higher-order members of the decay series in a matter of hours or days
due to their short half-lives. However, direct emissions from other higher-order gamma emitting
238U decay series radionuclides such as 234Th, 234mPa, 230Th and 226Ra were not observed, nor was
210Pb, a lower-order member of the series. 235U or any gamma emitting members of the 235U decay
series were also not observed. This may be due to the low relative abundance, or low emission
energies of the gamma rays and attenuation by the steel drums. The presence or absence of other
238U or 235U series radionuclides would need to be established using specialised lab-based gamma
2019
spectroscopy equipment.
Woomera Gamma Imaging
Page 6 of
22

 [FOR-OFFICIAL-USE-ONLY]
RELEASED
BY
ARPANSA
Figure 3: Gamma spectrum recorded at Location 3 s 33 - security
The spectrum is dominated by peaks
originating from the 238U decay series daughters, 214Bi and 214Pb.
Gamma Images
UNDER
Two radionuclides were identified above background in the gamma spectra for all locations; 214Bi
and 214Pb, which are 238U series daughter products. As such, gamma images were produced for
both radionuclides at each location using the a) 214Bi 609 keV peak with relative
abundance/intensity of 47% and b) the 214Pb 295 keV + 214Pb 351 keV peaks with relative
FOI
abundances/intensities of 19% and 36% respectively. For all locations, the distribution of 214Bi and
214Pb is similar. This is expected as 214Pb and 214Bi would be in equilibrium with each other and
higher-order members of the decay series.
FEBRUARY
In general, each image shows only a few drums that have elevated levels of radioactivity. The
count rates for all images were extremely low (~0.3-20 counts per second at the detector), which
required long acquisition times of ~2-4 hours per image. Furthermore, relatively high image noise
is attributed to contribution from background radiation and the presence of some radionuclides
originating from both the drum contents and the local background. Due to the long image
acquisition times required throughout different parts of each day, temperature drift of the detector
2019
energy calibration further contributed to increased image noise.
Most drums were observed to have historical labels on the side of the drums, although this
labelling is not always visible due to the direction the drums are facing or degradation. Two
labelling systems were observed; a set of original identifying numbers marked directly on the
drums and a set of updated identifying numbers marked by white stickers. Any other visible
markings on the drums were also noted to assist in the identification of listed drums.
Woomera Gamma Imaging
Page 7 of
22
 [FOR-OFFICIAL-USE-ONLY]
Figure 4 shows a gamma image using the 214Pb 295 keV and 214Pb 351 keV peaks,s 33 -
, which is an area with a particularly low count rate. Areas with mildly elevate
security d
radioactivity were located in the top right and middle areas of
The hot spot seen in the
bottom right of s 33 - and near the gazebo is likely image noise; this result can be considered as
inconclusive. The extrem
securi
ely low count rates under the 214Bi 609 keV peak meant that a 214Bi 609
keV gamma image
ty was unable to be produced without unacceptably high levels of image noise.
RELEASED
BY ARPANSA
UNDER
FOI
FEBRUARY
2019
Woomera Gamma Imaging
Page 8 of
22

[FOR-OFFICIAL-USE-ONLY]
RELEASED
s 33 - security
BY ARPANSA
Figure 4: Gamma image from 214Pb (295 keV + 351 keV peaks) at Location 1 UNDER
FOI
FEBRUARY
2019
Woomera Gamma Imaging
Page 9 of
22
 [FOR-OFFICIAL-USE-ONLY]
Figure 5 shows gamma images froms 33 - security
which are in the area identified as having
the highest dose rate in ANSTO report R180057: Woomera Characterisation: Gamma Survey of
Area 1, D. Boardman and S. Hagan (2018). A strong hotspot was identified on the bottom left of
The two drums with the elevated dose rate are the drums immediately to the right of the
two red drums in the bottom row (the red drums are partially obscured by the left sliding door in
Figure 5). The visible identifying marks on these drums are shown in Table 2.
RELEASED
Table 2
Drum
Updated
Original
Other markings
Number
Number
Left
None
3145
None
Right
05514
3147
FBK204
BY ARPANSA
UNDER
FOI
FEBRUARY
2019
Woomera Gamma Imaging
Page 10 of
22


[FOR-OFFICIAL-USE-ONLY]
RELEASED
s 33 - security
BY ARPANSA
UNDER
FOI
FEBRUARY
Figure 5: Gamma images from (top) 214Pb (295 keV + 351 keV peaks) and (bottom) 214Bi (609 keV peak) at Location 2
2019
Woomera Gamma Imaging
Page 11 of
22
 [FOR-OFFICIAL-USE-ONLY]
Figure 6 shows a close up, higher resolution gamma image of the two drums identified as hot
spots in Figure 5s 33 - security
. The bottom two thirds of both drums are identified as the
primary regions with radioactivity.
RELEASED
BY ARPANSA
UNDER
FOI
FEBRUARY
2019
Woomera Gamma Imaging
Page 12 of
22


[FOR-OFFICIAL-USE-ONLY]
RELEASED
s 33 - security
s 33 - security
BY ARPANSA
UNDER
FOI
FEBRUARY
Figure 6: Gamma images from (top) 214Pb (295 keV + 351 keV peaks) and (bottom) 214Bi (609 keV peak) at Location 3
2019
Woomera Gamma Imaging
Page 13 of
22
 [FOR-OFFICIAL-USE-ONLY]
Figure 7 shows gamma images from s 33 - security
One drum is identified to have a
significantly higher count rate compared to the surrounding drums. This drum is located to the
immediate right of the two green drums in the bottom right of s 33 - The updated number
identifying this drum is 05925, with no other visible identifying markers.
securit
y
RELEASED
BY ARPANSA
UNDER
FOI
FEBRUARY
2019
Woomera Gamma Imaging
Page 14 of
22


[FOR-OFFICIAL-USE-ONLY]
RELEASED
s 33 - security
s 33 - security
BY ARPANSA
UNDER
FOI
FEBRUARY
Figure 7: Gamma images from (top) 214Pb (295 keV + 351 keV peaks) and (bottom) 214Bi (609 keV peak) at Location 4
2019
Woomera Gamma Imaging
Page 15 of
22
 [FOR-OFFICIAL-USE-ONLY]
Figure 8 identifies a region of higher activity drums at
The
identifying marks on these drums are shown in Table 3.
Table 3
Drum
Updated
Original
Other markings
(as labeled in Figure 8)
Number
Number
A
RELEASED
06072
None
FBK9
B
06060
None
None
C
06061
None
None
D
None
None
None
E
05606
None
None
BY ARPANSA
UNDER
FOI
FEBRUARY
2019
Woomera Gamma Imaging
Page 16 of
22


[FOR-OFFICIAL-USE-ONLY]
RELEASED
s 33 - security
s 33 - security
BY ARPANSA
UNDER
FOI
FEBRUARY
Figure 8: Gamma images from (top) 214Pb (295 keV + 351 keV peaks) and (bottom) 214Bi (609 keV peak) at Location 5
2019
Woomera Gamma Imaging
Page 17 of
22

[FOR-OFFICIAL-USE-ONLY]
In Figures 4-8, the count rates in the 214Pb gamma images are higher than the 214Bi gamma
images. This is due to the wider energy range used for the 214Pb images and the relative
counting efficiency of the detector at different energies.
Future Work
Future imaging campaigns would incorporate several improvements from the lessons learnt
RELEASED
during this trip. Incorporating detector energy calibration temperature compensation
electronics, increased shielding beneath the detector for enhanced background radiation
attenuation, and slight adjustments to data acquisition parameters is likely to increase
signal-to-noise and overall image quality, as well as reduce total image acquisition time. In
addition, the implementation of LIDAR technology to capture 3D distance information of the
drums may enable the imager to be used for rapid drum activity estimation.
BY
Not all areas of the annex were accessible for imaging due to s 33 - security
Future campaigns would
ARPANSA
provide more comprehensive imaging at a greater range of locations. In future trips, there is
also possibility of deploying two imaging systems for simultaneous image acquisitions.
Further investigation into deploying a gamma imaging system to measure the top of the
drums through the use of a robot or elevated platform will also be undertaken.
UNDER
Conclusion
Gamma images were generated for the key radionuclides present in several locations along
FOI
the s 33 - security
at the Woomera site. The radionuclides detected
were 238U decay series daughters (214Bi and 214Pb). Only a very small proportion of drums
FEBRUARY
were identified to have elevated levels of radioactivity. Due to access restrictions and
shielding of the drums deep in the building, only the first layer drums could be imaged.
Two drums with elevated levels of radioactivity were located and identified to be in s 33 -
Subsequent higher resolution images of the drums of interest show that the radioactivity is
securit
primarily located within the bottom two thirds of these drums. In
one drum
y
s 33 -
with
elevated activity was located in the bottom, right side as well as a sma
securit ll cluster of five
drums in the top, left corner. Two hotspot areas were identified in the
y middle and top right
2019
regions of
Woomera Gamma Imaging
Page 18 of
22

[FOR-OFFICIAL-USE-ONLY]
Appendix A
s 33 - security
s 33 - security
RELEASED
BY ARPANSA
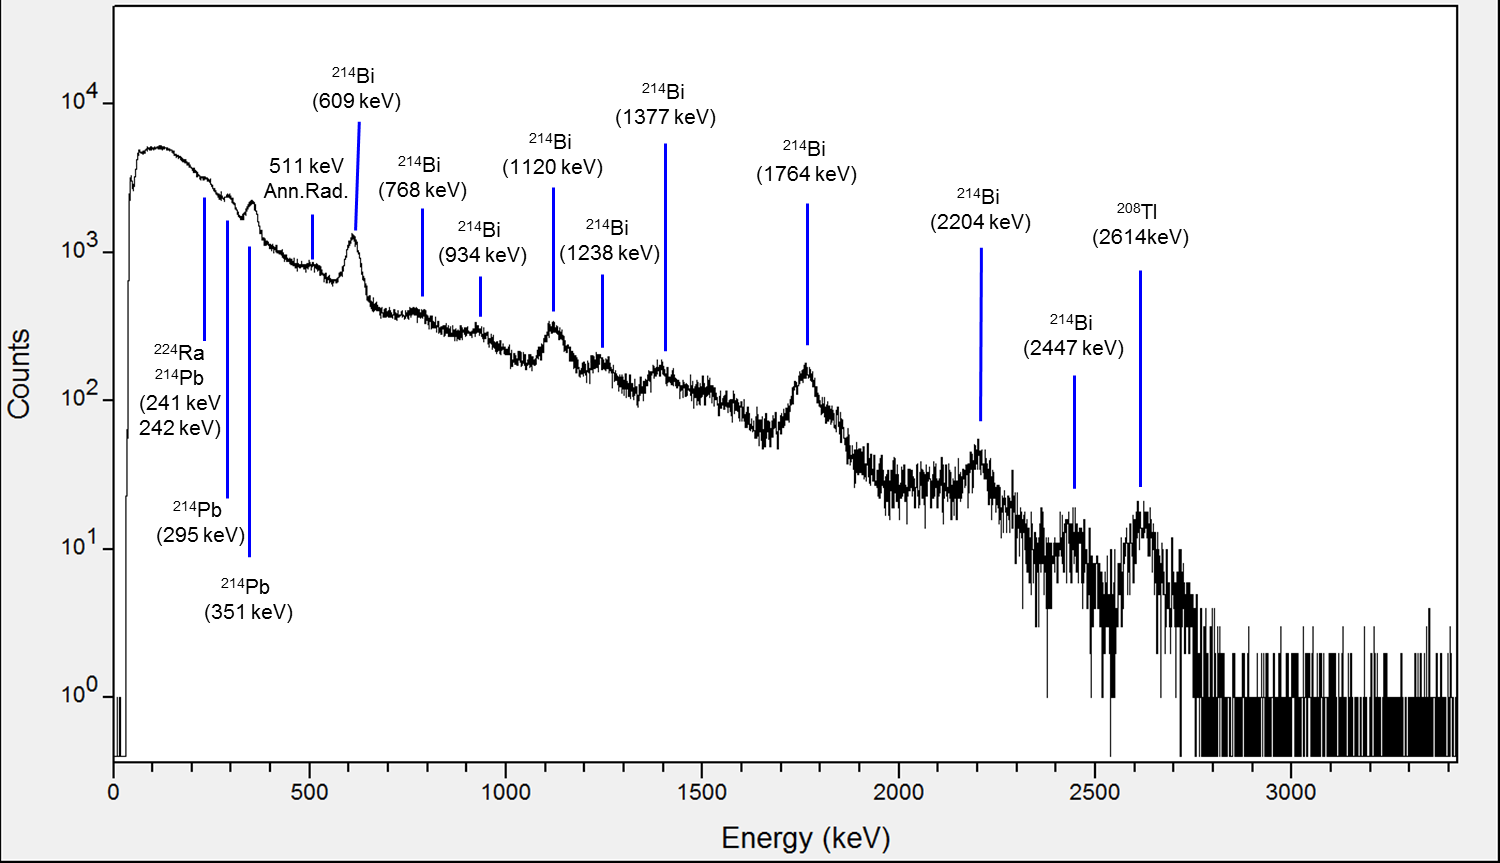
Figure A1: Gamma spectrum from Location 1 (256 minutes total acquisition)
UNDER
s 33 - security
FOI
FEBRUARY
2019
Figure A2: Gamma spectrum from Location 2 (256 minutes total acquisition)
Woomera Gamma Imaging
Page 19 of
22

[FOR-OFFICIAL-USE-ONLY]
s 33 - security
RELEASED
BY ARPANSA
Figure A3: Gamma spectrum from Location 3 (183 minutes total acquisition)
s 33 - security
UNDER
FOI
FEBRUARY
2019
Figure A4: Gamma spectrum from Location 4 (150 minutes total acquisition)
Woomera Gamma Imaging
Page 20 of
22

[FOR-OFFICIAL-USE-ONLY]
s 33 - security
RELEASED
BY ARPANSA
Figure A5: Gamma spectrum from Location 5 (205 minutes total acquisition)
UNDER
FOI
FEBRUARY
2019
Woomera Gamma Imaging
Page 21 of
22

[FOR-OFFICIAL-USE-ONLY]
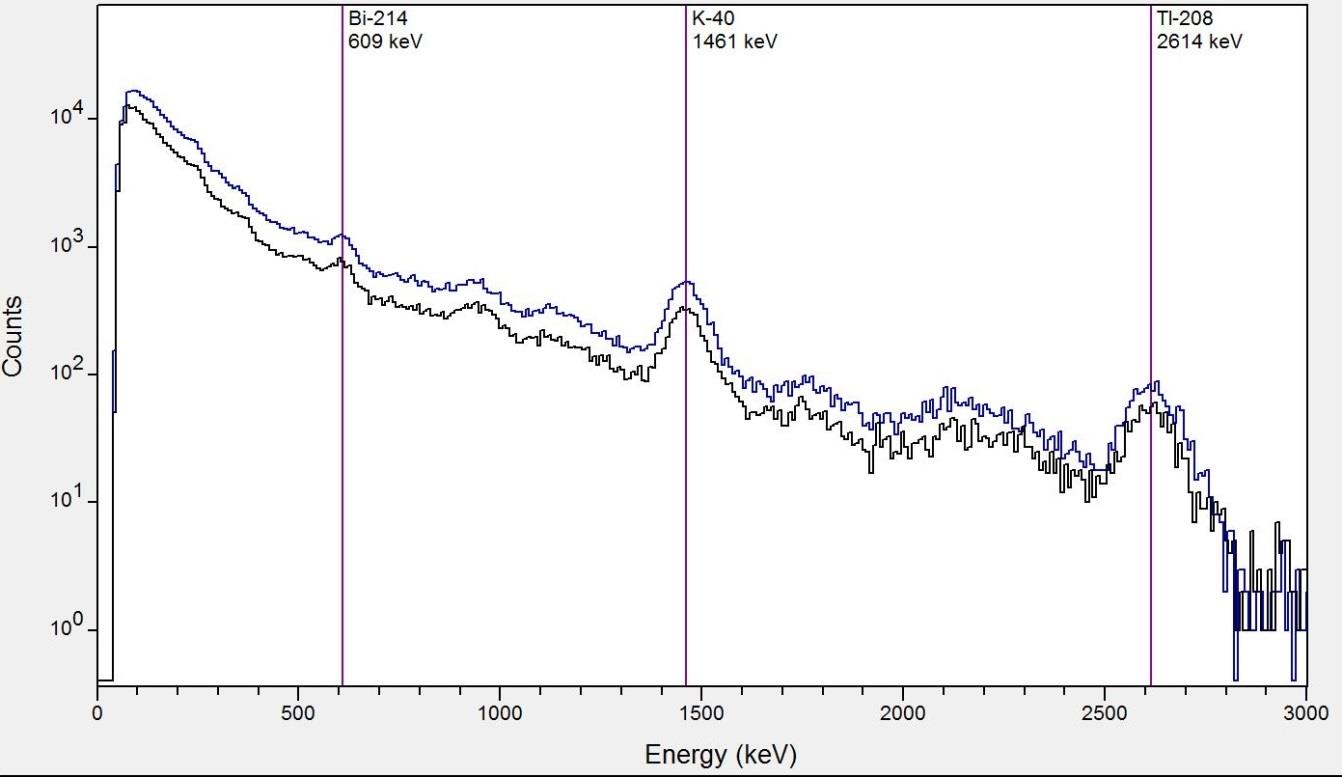
Reference Background Gamma Spectra (NE side of hangar and Eldo Hotel)
RELEASED
BY ARPANSA
Figure A6. Background gamma ray spectrum acquired on the north east side of the hangar (black line)
and the Eldo Hotel carpark (blue line). 1200 s total acquisition per spectra. Note the spectra in this
UNDER
figure were recorded with a different detector than the one used for Figures A1-A5. As such, direct
comparison of count rates in not meaningful.
FOI
FEBRUARY
2019
Woomera Gamma Imaging
Page 22 of
22