1
MONETARY POLICY NEAR THE ZERO LOWER BOUND
(2015) finds that there is a 14 per cent probability of the cash rate being at zero by
February 2017.
(2015) finds a 14 per cent probability that the cash rate will reach zero by February 2017.
D15/127109
GENERAL
1
Economist
Research
Economic Research Department
21 April 2015
D15/127109
GENERAL
2
Resources
M (2015), ‘Estimates of Uncertainty around the Market-implied Cash Rate Path’,
ER internal
note.
D15/127109
GENERAL
3
2
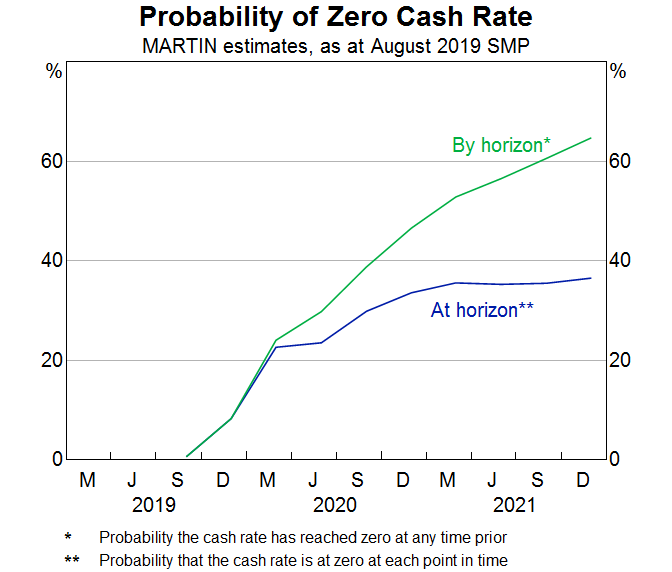
THE PROBABILITY OF REACHING THE ZERO LOWER BOUND
If forward rates make the same size errors as they have in the past, there is a 41 per cent probability of a zero
cash rate at December quarter 2021. Stochastic simulations of MARTIN imply a similar probability of
37 per cent.
The August SMP assumed the cash rate will decline to 42 basis points by mid‐2021. This raises the prospect
that monetary policy could soon be constrained by the zero lower bound (ZLB), limiting the ability of
monetary policy to offset future negative shocks.
(2015) calculates the distribution of historic errors in market expectations of the cash rate at different
horizons (Graph 1). Assuming the market makes similarly sized errors to those in the past gives the probability
that the cash rate will be constrained at the ZLB. Updated estimates using this approach are shown as the
orange line in Graph 2. The probability of reaching the ZLB is estimated to be 34 per cent at December 2020,
and 41 per cent at December 2021. The blue line in Graph 2 shows the probability of reaching the ZLB using
stochastic simulations in MARTIN (
forthcoming). 1
Graph 1
Graph 2
Cash Rate and Market-implied Path
Probability of Zero Cash Rate at Horizon*
Quarterly
As at August 2019 SMP
%
%
%
%
10
10
Forward rate errors
40
40
8
8
30
30
MARTIN
6
6
(preliminary)
Zero-coupon
forward rate
20
20
4
4
Cash rate target
10
10
2
2
Aug SMP projection
0
0
0
0
1996
2001
2006
2011
2016
2021
M
J
S
D
M
J
S
D
M
J
S
D
Source: RBA
2019
2020
2021
Source: RBA
The two approaches have different strengths and weaknesses. MARTIN’s estimates depend on many
assumptions and estimates. In particular, they assume that the cash rate follows a calibrated Taylor‐type rule
(see
&
2018) which is a very simple approximation to past RBA behaviour. The yield curve
approach assumes that the OIS curve makes the same size errors as it has in the past. In contrast to MARTIN,
forward rates should encompass all available information. Accordingly, unless one thought that forward rates
are seriously biased or misinformed, yield curve errors provides more credible point estimates of the
probability than MARTIN’s stochastic simulations. However, the two big advantages of using MARTIN are that
it enables estimation of how alternative policies might interact with the ZLB, and can quantify the costs of
constrained monetary policy (for example, in terms of additional unemployment). Both issues are discussed
in more detail in
(forthcoming). That said, the most important point is that both methods produce
very similar results, despite being constructed independently.
These results have important policy implications – if the probability of a zero cash rate is high, monetary
policy should arguably be more expansionary than would otherwise be the case, as discussed in
2015,
2016 and
2015).
Research Economist
Economic Research Department
21 August 2019
1 Thanks to
for helpful comments and running the MARTIN simulations.
D19/374060
GENERAL
1
Appendix A ‐ Measurement details
Following
(2015), I use zero‐coupon forward rates as a measure of market expectations for the path of
the cash rate. These forward rates are constructed using overnight index swap (OIS) rates, and yields on
Treasury notes and Commonwealth Government Securities. To calculate historic errors in cash rate
expectations, I take the market‐implied path of the cash rate on the first Wednesday of the months in which
the SMP is released. This should approximately reflect the cash rate expectations on which the Bank’s
forecasts have been conditioned. The cash rate `forecast error’ is then defined as the realised cash rate target
minus the corresponding zero‐coupon forward rate. I use EA’s cash rate assumption from the August SMP as
the baseline cash rate path.
In calculating the probabilities presented in this note I have used historic
absolute forward‐rate errors. Doing
so assumes that the forward curve is an unbiased forecast of the cash rate. An alternative approach could be
to assume that the cash rate forecast errors follow the same distribution as the historical distribution of
actual forecast errors. Under this approach, the probability of zero cash rate at December quarter 2021 is
60 per cent.
D19/374060
GENERAL
2
link to page 6
3
THE EFFECTIVE LOWER BOUND AND ITS IMPLICATIONS
As the cash rate declines, the possibility of reaching its Effective Lower Bound (ELB) becomes a more
pressing concern. Stochastic simulations in MARTIN show that the likelihood of a zero cash rate in December
2021 has risen to around 40 per cent as at the August 2019 SMP from around 20 per cent at the May 2019
SMP.
Introduction
In this note I estimate the probability of reaching the ELB using MARTIN, incorporate an ELB in to MARTIN’s
policy rule and discuss some of the implications of being constrained by the lower bound.
Probability of reaching the ELB
Stochastic simulations in MARTIN estimate that the likelihood of reaching an ELB is relatively high and has
increased recently
(Graph 1).3 For example, there is a 37 per cent chance of being at the zero lower bound
at the end of the forecast horizon, according to MARTIN. This estimate was just 18 per cent at the May 19
SMP. Non-parametric methods using market pricing produce similar results (
2019). If we measure
the probability of having reached a cash rate of zero by the forecast horizon, instead of necessarily being at
zero at the forecast horizon, the estimate is around 60 per cent.
Graph 1
.
3 I use 10,000 draws of historical errors, apply these errors as shocks to MARTIN and measure how many of the scenarios result
in a cash rate at or below 0. See
2019 for more detail on stochastic simulations in MARTIN.
D19/196145
GENERAL
1
Limitations and further work
This work abstracts from agents’ expectations of future monetary policy, which are likely to be an
important element when the central bank is constrained by the ELB. Further work will look to incorporate
expectations into the ELB framework presented in this note.
Conclusion
Stochastic simulations in MARTIN show that the likelihood of a zero cash rate in December 2021 has risen
in recent months to around 40 per cent as at the August 2019 SMP. Simple
Macroeconomic Modelling
Economic Analysis Department
8 October 2019
D19/196145
GENERAL
6
link to page 8
4
ESTIMATES OF UNCERTAINTY AROUND THE MARKET-IMPLIED CASH RATE PATH
This note estimates the uncertainty around a market-implied path of the cash rate using the historical
distribution of differences between zero-coupon forward rates and the actual cash rate target. The width of
the estimated 90 per cent confidence interval is about ±3 percentage points at the two-year horizon. If the
distribution of forward-rate errors is similar to that over the past two decades, the market path at the time
of the February SMP implies that the probability of a zero cash rate in February 2017 is 14 per cent.
Introduction
Forecasts presented in the February Statement on Monetary Policy (SMP) were conditioned on the
assumption that the cash rate moves broadly in line with expectations inferred from market pricing.1 While
the SMP was careful to stress that ‘this assumption does not represent a commitment by the Board to any
particular path for policy’, it may be desirable to reinforce this point. One way of doing this is by graphically
presenting confidence intervals around the market-implied cash rate path (i.e. the cash rate ‘forecast’), as
is done for the SMP forecasts of GDP growth, inflation and, more recently, unemployment. Additionally,
estimates of uncertainty around the cash rate forecast can be used to estimate the probability of the cash
rate reaching zero, which may be an important consideration when determining the appropriate path of
policy.2
Some other central banks present measures of uncertainty around their policy rate projections. For
example, the US Federal Reserve publishes model-based confidence intervals and the distribution of
Federal Open Market Committee participants’ projections of the appropriate path of the federal funds rate.
The Riksbank publishes a forecast repo rate path, with confidence intervals based on the Riksbank’s own
forecasting errors and the historical ability of forward rates to forecast the repo rate (Kjellberg and Villani
2010; Sveriges Riksbank 2015).3 Norges Bank publishes forecasts of the ‘key policy rate’ based on
judgement about the appropriate path of monetary policy, with confidence intervals generated using a
macroeconomic model (Norges Bank 2005, 2014).
Graph 1
Cash Rate and Market-implied Path
Data and methodology
Quarterly
%
%
I use estimated zero-coupon forward rates as a
measure of market expectations for the path of the
10
10
cash rate
(Graph 1). These forward rates are
Zero-coupon
forward rate
constructed using overnight index swap (OIS) rates,
8
8
and yields on Treasury notes and Commonwealth
Government Securities.4 For the purposes of this
6
6
analysis, the market-implied path of the cash rate
4
4
is taken as being the zero-coupon forward curve on
Cash rate target
the first Wednesday of the months in which the
2
2
SMP is released (i.e. the day after the Board’s cash
rate decision), as this should be a reasonable
0
0
approximation of the cash rate expectations on
1993
1999
2005
2011
2017
which the Bank’s SMP forecasts could be
Source: RBA
conditioned. The realised cash rate target is taken to be the cash rate target on the same days. The cash
rate ‘forecast error’ is defined as the realised cash rate target minus the corresponding zero-coupon
1 In previous SMPs, forecasts were conditioned on the assumption of a constant cash rate.
2
(forthcoming) reviews the literature discussing the appropriate setting of monetary policy given the existence of a
lower bound on nominal interest rates.
3 The Riksbank uses two sources of forecasts errors because the history of its own forecasts is too short to precisely estimate
confidence intervals around the repo rate projection.
4 There are three main sources of data used by the Bank to infer market-implied cash rate expectations: interbank cash rate
futures (e.g. Figure 4.1 of the
February SMP); OIS (e.g. DM Monthly Note – March 2015); and estimated zero-coupon forward
rates (e.g.
Statistical Table F17, Finlay and Chambers (2008) and Finlay and Olivan (2012) – see these papers for details on how
the zero-coupon forward rates are estimated). Differences between cash rate expectations implied by these data sources
appear to be small. I use zero-coupon forward rates because of their longer horizon and availability from an earlier date.
D15/126403
1
link to page 9 link to page 9
forward rate. Cash rate forecast errors are calculated at quarterly horizons up to nine quarters ahead over
the inflation-targeting period.
Summary statistics
Table 1 presents statistics describing cash rate forecast errors. The market-implied cash rate path appears
to be roughly unbiased at short horizons, but the size of the average error (or bias) increases with the
horizon (although it is not significantly different to zero at the 5 per cent level of significance at forecast
horizons less than eight quarters ahead). The bias at longer horizons could reflect the existence of a
positive term premium (discussed below). The average magnitude of errors, as measured by the mean
absolute error (MAE) and root-mean-square error (RMSE), also increases with the forecast horizon.
Table 1: Cash Rate Forecast Errors Based on Zero-coupon Forward Rates – Summary Statistics
Percentage points
Forecast horizon
One quarter
Two quarters
Four quarters
Eight quarters
0.04
−0.06
−0.21
−0.67
Average error(a)
(0.22)
(0.48)
(0.26)
(0.03)
MAE
0.23
0.39
0.81
1.39
RMSE
0.34
0.64
1.07
1.56
Maximum absolute error
1.59
3.36
3.64
3.84
Forecast origin
August 2008
August 2008
May 2008
February 1995
No. of observations
86
85
83
79
(a) p-values (in brackets) based on a constant-only regression with Newey-West standard errors
Source: RBA
Confidence intervals
Graph 2 presents the 70th and 90th percentiles of the historical distribution of absolute forecast errors.5 As
expected, the percentiles tend to increase with the forecast horizon; the 90th percentile of absolute four-
quarter-ahead forecast errors is around 1.7 percentage points, while it is around 2.9 percentage points at
the eight-quarter-ahead horizon. Using the distribution of
absolute forecast errors to construct confidence
intervals assumes that the distribution of forecast errors is symmetric and centred at zero; that is, it
assumes that any bias and skewness in the sample of forward-rate errors will not persist into the future (it
is not necessary to assume normality). These are the same assumptions made in constructing the
confidence intervals presented in the SMP.
Graph 2
Graph 3
Cash Rate Forecast Confidence Intervals*
Cash Rate Forecast*
Percentiles of absolute forecast errors since 1993
Quarterly
ppt
ppt
%
%
90th percentile
70 per cent
interval
2
2
4
4
70th percentile
1
1
2
2
0
0
90 per cent interval
1
2
3
4
5
6
7
8
9
0
0
Horizon: quarters from forecast origin
2012
2013
2014
2015
2016
2017
* Forecasts based on zero-coupon forward rates
* Based on zero-coupon forward rates
Source: RBA
Source: RBA
5 This choice of percentiles matches those used in constructing the confidence intervals presented in the SMP.
D15/126403
2
link to page 9 link to page 10
Graph 3 shows the market-implied cash rate path as at the February 2015 SMP, along with the
70 and 90 per cent confidence intervals based on the distribution of absolute forecast errors. The intervals
are substantially wider than some alternatives. For example, the 90 per cent probability interval around the
Economic Research (ER) model-based cash rate forecast is around ±2 percentage points at the two-year
horizon, although this partly reflects the fact that this interval is based on in-sample fit, rather than on
historical out-of-sample forecasting performance.6 The market-implied intervals are also probably wider
than some people’s subjective assessment of current uncertainty around the path of the cash rate.
However, psychological studies find that subjective estimates of uncertainty tend to be too low (often by
large margins), even among experts.7
In presenting the confidence intervals, I truncate them at zero, consistent with the approach taken by
Norges Bank (Norges Bank 2014).8 However, in reality the effective lower bound on the nominal policy rate
may be different to zero for technical reasons. For example, the Fed and Bank of England have positive
effective lower bounds, while the Riksbank and the Swiss National Bank currently have negative policy
rates. In contrast to the approach taken here, the Riksbank does not truncate its repo rate forecast
distribution at a lower bound, so that the forecast distribution has considerable probability mass at repo
rates as low as −2 per cent (Sveriges Riksbank 2015). This may strike some readers as implausible. However,
Kjellberg and Villani (2010) argue that this can be justified in two ways: 1) the zero lower bound is not
exactly zero, implying that moderately negative interest rates cannot be ruled out; and 2) negative policy
rates in the forecast distribution can be taken to represent alternative monetary policy measures with the
same effect as though the policy rate were negative.
Probability of reaching the zero lower bound
Graph 4
Probability of Zero Cash Rate at Horizon*
The intersection of the horizontal axis and the
As at February 2015 SMP
confidence intervals in Graph 3 provides an
%
%
estimate of the probability of a zero cash rate at a
Based on historical distribution
of forecast errors
given forecast horizon, conditional on the market-
30
30
implied cash rate path at the time of the February
SMP. The pink line in
Graph 4 shows this
20
20
probability at different forecast horizons, assuming
that the distribution of absolute forward-rate
errors is the same as over the past two decades
10
10
and that these errors are symmetrically distributed
Based on historical
distribution of
absolute
around zero. The market path implies that the
forecast errors
0
0
probability of the cash rate being at the zero lower
May-15
Nov-15
May-16
Nov-16
May-17
bound is 5 per cent in February 2016 and 14 per
Horizon
cent in February 2017.
* Based on zero-coupon forward rates
Source: RBA
Using absolute errors assumes that the forward curve provides an unbiased forecast of the cash rate. As
mentioned above, this assumption is also made in constructing the SMP confidence intervals, although the
rationale differs here. Tulip and Wallace (2012) argue that any bias in economic forecasts should not persist
into the future, since it is in the forecaster’s interest to generate unbiased forecasts. However, in the case
of the cash rate, this assumption is equivalent to assuming that any term premia in the zero-coupon
forward rates are zero on average. However, this might not be the case if investors require (or a willing to
pay) a premium for holding longer-maturity assets.
An alternative approach is to assume that cash rate forecast errors follow the same distribution as the
historical distribution of
actual forecast errors. This allows the forecast error distribution to have a mean
equal to the average forward-rate error, which can be interpreted as the average term premium. It also
preserves the historical skewness in the data. Under this approach, shown as the purple line in Graph 4, the
6 See Graph 3 in
and
(2015) (restricted).
7 See Kahneman, Slovic and Tversky (1982) (Part VI, titled ‘Overconfidence’) or, for an accessible summary, the Wikipedia (2012)
entry ‘Overconfidence Effect’.
8 Truncation means that forward rates represent the median but not the mean of the cash rate forecast distribution, since the
truncated distribution is asymmetric. However, the expectations theory of the yield curve implies that forward rates should
equal the mean. I ignore this complication here, but recognise that it would need to be addressed in further work.
D15/126403
3
link to page 11
probability of a zero cash rate is estimated to be 9 per cent in February 2016 and 27 per cent in
February 2017. These probabilities are substantially higher than those based on the historical distribution
of absolute forecast errors, because the sample includes more large negative forecast errors (i.e. where the
realised cash rate turned out to be substantially lower than forecast) than large positive forecast errors
(Graph 5).
Graph 5
Although the purple line in Graph 4 is simpler to
Histogram of Cash Rate Forecast Errors*
construct and explain, and requires fewer
Relative frequency, eight-quarter-ahead horizon
assumptions, the pink line will be more valid if the
%
%
apparent bias in the market-implied path at longer
horizons has arisen by chance and is likely to
20
20
disappear. Consistent with this, Finlay and
Chambers (2008) find evidence to suggest that
15
15
term premia at maturities up to five years were
small and
negative through most of the inflation-
10
10
targeting period up to 2007 (although they were
positive and relatively large in the mid 1990s,
5
5
which coincides with several large negative cash
rate forecast errors). Additionally, the cash rate
0
0
expectations presented in the DM Monthly Note
<-3
-3 to -2 -2 to -1 -1 to 0
0 to 1
1 to 2
2 to 3
>3
and the SMP are not adjusted for term premia.9
* Based on zero-coupon forward rates
Source: RBA
Stability of uncertainty measures
The estimates in this note are conditional on the shocks experienced during the inflation-targeting period,
but this may not be representative of the shocks that will be experienced in the future. Specifically, there
may be periods when the path of the cash rate is more or less uncertain (i.e. the cash rate forecast errors
could be heteroskedastic). This might be the case if, for instance, the Bank’s communications and policy
reaction function have become clearer, so that market participants are better able to predict the path of
the cash rate, or if the variance of economic shocks has declined.
As a rough test of the stability of the variance of the forecast error distribution, I regress the squared cash
rate forecast errors on a constant and a dummy variable that is equal to one after the Bank began explicitly
publishing its forecasts in the SMP (February 2007). I use Newey-West standard errors to account for
autocorrelation. I am unable to reject the null hypothesis that the coefficient of the dummy variable is
equal to zero at any of the forecast horizons considered, suggesting that improvements in the Bank’s
communication have not improved the market’s ability to forecast changes in the cash rate. However, this
test is fairly rudimentary and the results are sensitive to the exclusion of the large forecast errors arising
during the global financial crisis. At face value, the results provide little evidence to suggest that the
variance of the forecast error distribution, and thus the width of the confidence intervals, has changed over
time.
Conclusion
As the discussion above indicates, different assumptions about bias, skewness, stability and so on could be
made in estimating uncertainty about the market-implied cash rate path. Although these would change
numerical estimates, they are unlikely to greatly change the qualitative results. Specifically, uncertainty
about the future cash rate is large (arguably, this is the key point that publication of confidence intervals
needs to convey) and the probability of hitting the zero lower bound is substantial.
Economist
Economic Research Department
14 April 2015
9 Some central banks adjust forward rates for the existence of risk premia. For example, the Fed uses a rule-of-thumb that the
term premium is equal to one basis point per month (e.g. Board of Governors of the Federal Reserve System 2009). Up to
September 2008, the Riksbank adjusted forward rates at each horizon by subtracting the average forward-rate error (Kjellberg
and Villani 2010). Since then, the Riksbank has adjusted forward rates by subtracting model-based estimates of risk premia.
D15/126403
4
References
Board of Governors of the Federal Reserve System (2009), Monetary Policy Alternatives, December.
Finlay R and M Chambers (2008), ‘A Term Structure Decomposition of the Australian Yield Curve’, RBA
Research Discussion Paper No 2008-09.
Finlay R and D Olivan (2012), ‘Extracting Information from Financial Market Instruments’, RBA
Bulletin,
March, pp 45–54.
Kahneman D, P Slovic and A Tversky (eds) (1982), Judgment under Uncertainty: Heuristics and Biases,
Cambridge University Press, Cambridge.
Kjellberg D and M Villani (2010), ‘The Riksbank’s Communication of Macroeconomic Uncertainty’, Sveriges
Riksbank
Economic Review, 1, pp 5–41.
D (forthcoming), ‘Monetary Policy near the Zero Lower Bound’, internal ER note.
Norges Bank (2005), ‘Uncertainty Surrounding Future Interest Rate Developments’,
Inflation Report,
3/2005, pp 19–21.
Norges Bank (2014), Monetary Policy Report, 4/2014.
Sveriges Riksbank (2015), Monetary Policy Report, February.
Tulip P and S Wallace (2012), ‘Estimates of Uncertainty around the RBA's Forecasts’, RBA Research
Discussion Paper No 2012-07.
Wikipedia (2012), ‘Overconfidence Effect’, accessed 10 January 2012.
D15/126403
5
5
ALTERNATIVE INTEREST RATE PATHS – APRIL 2015
Forecast targeting1
D15/145971
1
Given the market-implied cash rate path in the baseline scenario, and assuming that
uncertainty around this cash rate forecast is as estimated in
(2015), the probability of a zero cash rate
in two years’ time is 15 per cent (Graph 2).2
Graph 2
Probability of Zero Cash Rate at Horizon*
As at April 2015
%
%
15
15
10
10
5
5
0
0
Jul-15
Jan-16
Jul-16
Jan-17
Horizon
* Based on market-implied cash rate path and the historical ability of zero-
coupon forward rates to forecast the cash rate; assumes forecast errors
are symmetric
Source: RBA
and
/Economists/Economic Research Department/23 April 2015
2 This estimate assumes that cash rate forecast errors follow the same distribution as the historical distribution of
absolute
forecast errors (based on zero-coupon forward rates) and that these errors are symmetrically distributed around the cash rate
forecast; assuming that cash rate forecast errors follow the historical distribution of
actual errors results in a substantially
higher probability of the cash rate reaching zero.
D15/145971
2
6
ALTERNATIVE INTEREST RATE PATHS – JULY 2015
Forecast targeting
D15/259070
1
link to page 16
Given the market-implied cash rate path in the baseline scenario, and assuming that
uncertainty around this cash rate forecast is as estimated in
(2015), the probability of a zero cash rate
in two years’ time is 15 per cent (Graph 2).
2
Graph 2
Probability of Zero Cash Rate at Horizon*
As at July 2015
%
%
15
15
10
10
5
5
0
0
Oct-15
Apr-16
Oct-16
Apr-17
Horizon
* Based on market-implied cash rate path and the historical ability of zero-
coupon forward rates to forecast the cash rate; assumes forecast errors
are symmetric
Source: RBA
Economist/Economic Research Department/20 July 2015
2 This estimate assumes that cash rate forecast errors fol ow the same distribution as the historical distribution of absolute
forecast errors (based on zero-coupon forward rates) and that these errors are symmetrically distributed around the cash rate
forecast; assuming that cash rate forecast errors follow the historical distribution of actual errors results in a substantial y
higher probability of the cash rate reaching zero.
D15/259070
2
7
ALTERNATIVE INTEREST RATE PATHS – OCTOBER 2015
Forecast targeting
D15/386771
1
link to page 18
Given the market-implied cash rate path in the baseline scenario, and assuming that
uncertainty around this cash rate forecast is as estimated in
(2015), the probability of a zero cash rate
in early 2018 is about 15 per cent (Graph 2).
2
Graph 2
Probability of Zero Cash Rate at Horizon*
%
%
15
15
10
10
5
5
0
0
Jan-16
Jul-16
Jan-17
Jul-17
Horizon
* Based on market-implied cash rate path and the historical ability of zero-
coupon forward rates to forecast the cash rate; assumes forecast errors
are symmetric
Source: RBA
2 This estimate assumes that cash rate forecast errors fol ow the same distribution as the historical distribution of absolute
forecast errors (based on zero-coupon forward rates) and that these errors are symmetrically distributed around the cash rate
forecast; assuming that cash rate forecast errors follow the historical distribution of actual errors results in a substantial y
higher probability of the cash rate reaching zero.
Economist
Economic Research Department
21 October 2015
D15/386771
2
8
ALTERNATIVE INTEREST RATE PATHS – JANUARY 20161
Forecast targeting
D16/25458
1
Given the market-implied cash rate path in the
baseline scenario, and assuming that uncertainty around this cash rate forecast is as estimated in
(2015), the probability of a zero cash rate in early 2018 is about 15 per cent (Graph 2).
Graph 2
Probability of Zero Cash Rate at Horizon*
%
%
15
15
10
10
5
5
0
0
Apr-16
Oct-16
Apr-17
Oct-17
Horizon
* Based on market-implied cash rate path and the historical ability of zero-
coupon forward rates to forecast the cash rate; assumes forecast errors
are symmetric
Source: RBA
Economist
Economic Research Department
20 January 2016
D16/25458
2
9
ALTERNATIVE INTEREST RATE PATHS – APRIL 20161
Forecast targeting
D16/135645
1
Given the market-implied cash
rate path in the baseline scenario, and assuming that uncertainty around this cash rate forecast is as
estimated in
(2015), the probability of a zero cash rate in two years is 14 per cent (Graph 2).
Graph 2
Probability of Zero Cash Rate at Horizon*
%
%
15
15
10
10
5
5
0
0
Jul-16
Jan-17
Jul-17
Jan-18
Horizon
* Based on market-implied cash rate path and the historical ability of zero-
coupon forward rates to forecast the cash rate; assumes distribution of
forecast errors is symmetric
Source: RBA
/Economist/Economic Research Department/20 April 2016
D16/135645
2
10
ALTERNATIVE INTEREST RATE PATHS – JULY 20161
Forecast targeting
D16/254859
1
Given the market-implied cash rate path in the
baseline scenario, and assuming that uncertainty around this cash rate forecast is as estimated in
(2015),
the probability of a zero cash rate at the end of the forecast horizon is 21 per cent (Graph 2).
Graph 2
Probability of Zero Cash Rate at Horizon*
%
%
20
20
15
15
10
10
5
5
0
0
Oct-16
Apr-17
Oct-17
Apr-18
Oct-18
Horizon
* Based on market-implied cash rate path and the historical ability
of zero-coupon forward rates to forecast the cash rate; assumes
distribution of forecast errors is symmetric.
Source: RBA
Economic Research Department
20 July 2016
D16/254859
2
11
ALTERNATIVE INTEREST RATE PATHS – OCTOBER 2016
Forecast targeting
D16/391044
1
Given the market-implied cash rate path in the baseline scenario, and assuming that uncertainty around this
cash rate forecast is as estimated in
(2015), the probability of a zero cash rate at the end of the forecast
horizon is 21 per cent (Graph 2).
Graph 2
Probability of Zero Cash Rate at Horizon*
%
%
20
20
15
15
10
10
5
5
0
0
Nov-16
May-17
Nov-17
May-18
Nov-18
Horizon
* Based on market-implied cash rate path and the historical ability
of zero-coupon forward rates to forecast the cash rate; assumes
distribution of forecast errors is symmetric.
Source: RBA
Economic Research Department
19 October 2016
D16/391044
2
12
ALTERNATIVE INTEREST RATE PATHS – JANUARY 2017
Forecast targeting
D17/26813
1
Given the market-implied cash rate path, and
assuming that uncertainty around this cash rate forecast is as estimated in
(2015), the probability of a
zero cash rate at the end of the forecast horizon is 9½ per cent (Graph 2).
Graph 2
Probability of Zero Cash Rate at Horizon*
%
%
10
10
8
8
6
6
4
4
2
2
0
0
Apr-17
Oct-17
Apr-18
Oct-18
Apr-19
Horizon
* Based on market-implied cash rate path and the historical ability
of zero-coupon forward rates to forecast the cash rate; assumes
distribution of forecast errors is symmetric.
Source: RBA
Economic Research Department
25 January 2017
D17/26813
2
13
ALTERNATIVE INTEREST RATE PATHS – APRIL 2017
Forecast targeting
D17/124820
1
Given the market-implied cash rate path, and assuming that uncertainty around this cash rate forecast
is as estimated in
(2015b), the probability of a zero cash rate at the end of the forecast horizon is 9½
per cent (Graph 2).
Graph 2
Probability of Zero Cash Rate at Horizon*
%
%
10
10
8
8
6
6
4
4
2
2
0
0
Jul-17
Jan-18
Jul-18
Jan-19
Jul-19
Horizon
* Based on market-implied cash rate path and the historical ability
of zero-coupon forward rates to forecast the cash rate; assumes
distribution of forecast errors is symmetric.
Source: RBA
Economic Research Department
19 April 2017
D17/124820
2
14
ALTERNATIVE INTEREST RATE PATHS – JULY 2017
Forecast targeting
D17/248278
1
Given the market-implied cash rate path, and assuming that uncertainty
around this cash rate forecast is as estimated in
(2015b), the probability of a zero cash rate at the end of
the forecast horizon is 11 per cent (Graph 2).
Graph 2
Probability of Zero Cash Rate at Horizon*
%
%
10
10
8
8
6
6
4
4
2
2
0
0
Oct-17
Apr-18
Oct-18
Apr-19
Oct-19
Horizon
* Based on market-implied cash rate path and the historical ability
of zero-coupon forward rates to forecast the cash rate; assumes
distribution of forecast errors is symmetric.
Source: RBA
Economic Research Department
19 July 2017
D17/248278
2
Document Outline