


Impact of climate change
on demand
Linking the science to decision making
29/08/2019
1


The impact
Infrastructure development in Sydney
should plan for a marginal increase of;
•
2.23% (in 2020-2040),
•
4.4% (in 2060-2080),
In demand for water, due to climate change
29/08/2019
2


The problem
Climate change alters
Weather is the strongest
weather
factor driving fluctuations in water
demand
(Up to 50GL a year).
Therefore climate change
would Influence
demand
By how much and when …?
29/08/2019
3
Demand forecasting
• Demand is forecast, at four to five year, and 50 year time scales, to inform
• pricing proposals to the Independent Pricing and Regulatory Tribunal
(IPART), and
• capital investments in infrastructure.
• The (regression) model considers, population, dwelling characteristic and
weather as input,
• The model is developed using actual weather, but forecasts are generated
assuming average (30 year) climatic conditions.
• This is likely to under forecast demand, in light of climate change
29/08/2019
4
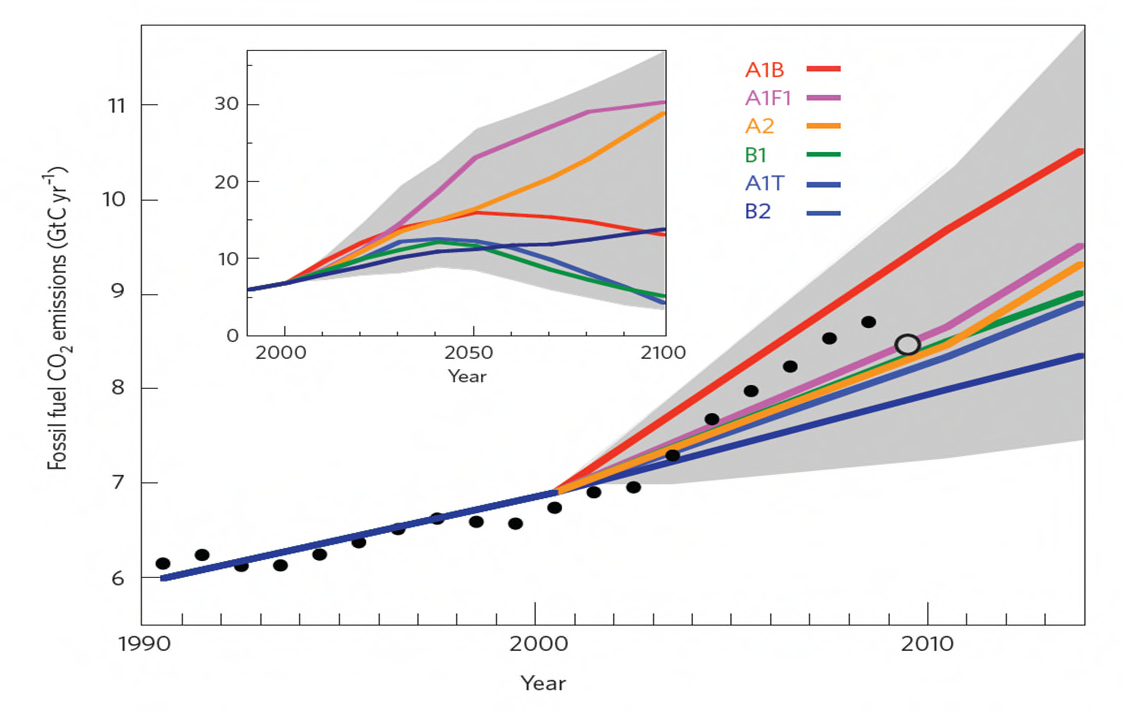
Global (climate change) scenarios
It is not clear how the global socio-economic systems will respond to emissions in the future.
Special Report on
Emission Scenarios
A1B – ~ 4.8 deg
(SRES) - IPCC
A2 – ~ 3.7 deg
A1
B2 – ~ < 2 deg
29/08/2019
5
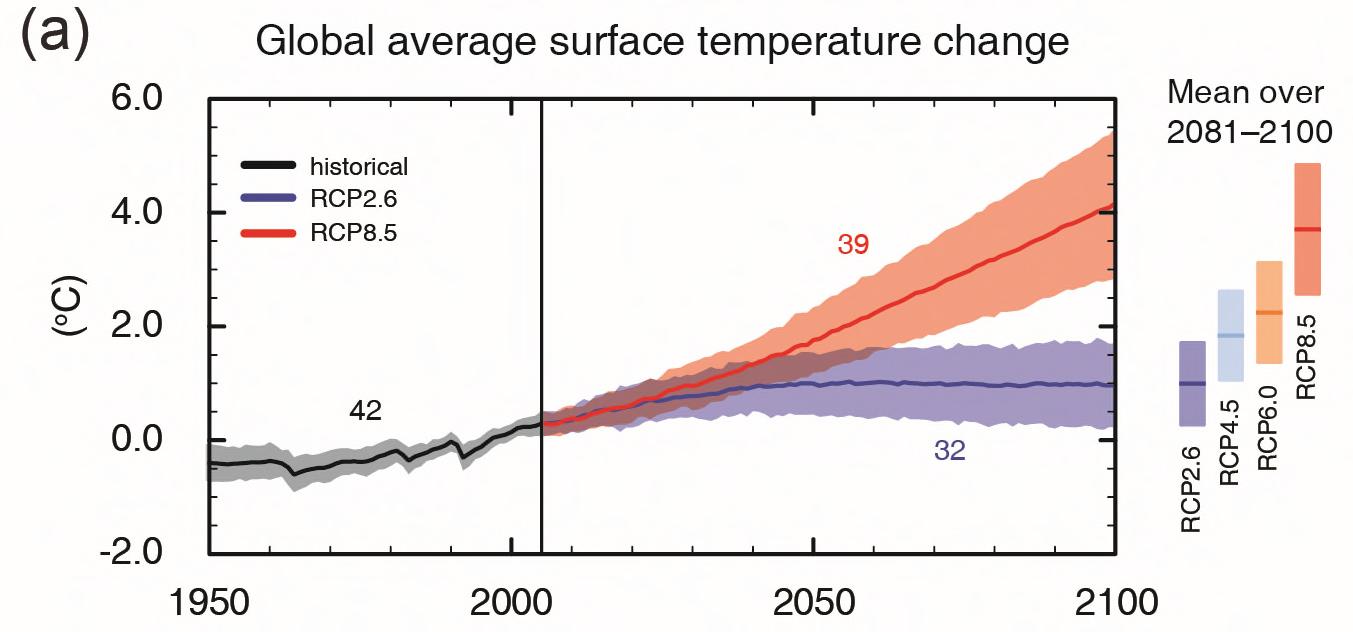
Global (climate change) scenarios
Representative Concentration Pathways (RCP), considers incorporates potential mitigation scenarios.
Futures
markets
+4oC
A1 P
Paris
agreement
+1oC
29/08/2019
6
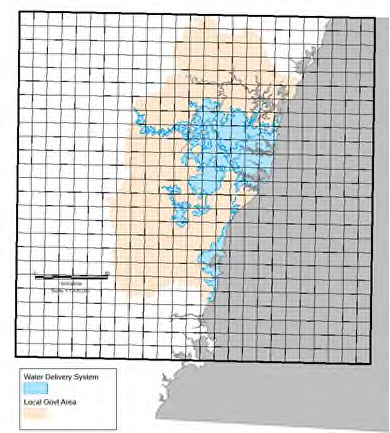
How does it impact Sydney
NSW and ACT Regional Climate Modelling (NARCliM)
A joint project by the NSW Government and the University of New
South Wales to downscale outputs of global climate models.
• 4 global models (CCCM3.1, ECHAM5, CSIRO-Mk3.0, MIROC3.2)
• 3 downscaling methods
• 12 projections
• A2 Emission Scenarios
29/08/2019
7
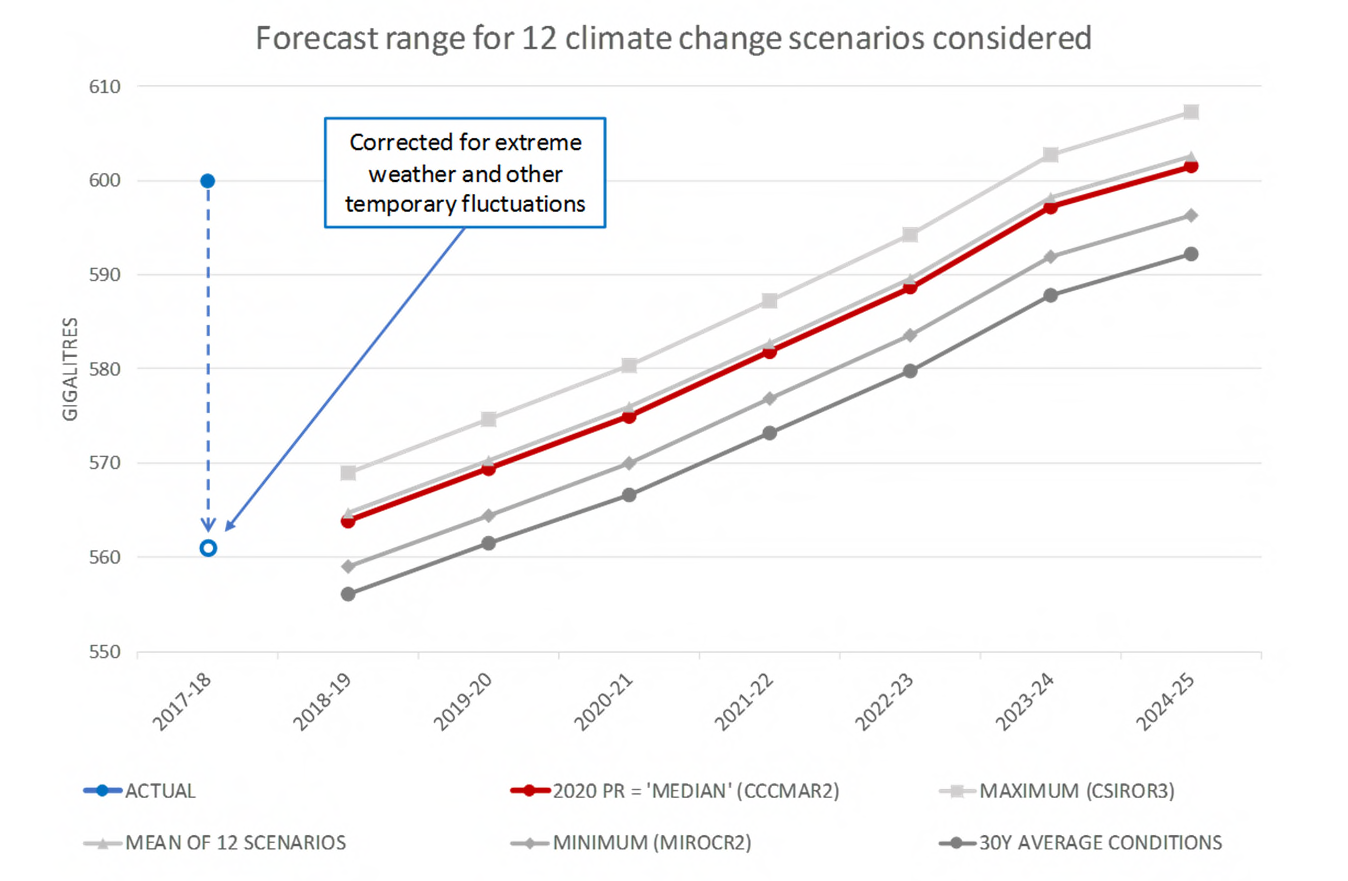
Integrating with demand forecasts by
•
Integrating NARCLiM outputs with Sydney Water’s demand forecasting models.
•
But climate models typically predict averages, whereas demand is mostly driven by
extreme events (severity and frequency)
•
Build a ‘weather generator’ that develops Monte-Carlo simulation, of daily
weather scenarios based on, NARCLiM projections
•
And NARCLiM does not produce a single projection, but generates 12 equally likely
projection scenarios (which one to use).
•
Develop a decision framework to select an output base on the risk tolerance of
the decision it informs.
29/08/2019
8
Integrating the models
Weather
100 weather
SW Demand
Demand
100 Demand
generator
scenarios
model
Average
scenario 1
Iterations
Weather
SW Demand
100 weather
100 Demand
Demand
generator
model
Average
scenarios
Iterations
scenario 12
12 climate projections
1200 weather scenarios
1200 demand iterations 12 demand scenarios
A2 Emission
12 demand
NARCLiM
Scenario
scenarios
29/08/2019
9
9
Choosing one of the 12 projections
• Is a policy, rather than a scientific, decision.
• Do not have to use the same projection for all decisions/purposes.
• Use the projection most appropriate to the risk tolerance of the decision it informs
(Eg. if cost of error is too high, use the worst case scenario)
Select scenario where,
1.
Overall cost of error is minimal
2.
Ability to respond to error is maximum
3.
Impact of error is (nearly) equitably distributed among stakeholders
29/08/2019
Choosing one of the 12 projections
Eg. Pricing & Investment in infrastructure
Decision
Direction of Impact of error
Impact of error on Ability & speed to
Projection to
error
on NSW Govt
customer
respond
use
(SW)
Retail price
Over forecast Loss of revenue
High
Middle case
determination
Under
High price
High
forecast
Infrastructure/water
Over forecast Wasted
Potential to catch
Worst case
security planning
investment
up in time
Under
Service failure
Slow
forecast
/constrain
29/08/2019
11
Potential impact on the short term
(experimental – draft only)
29/08/2019
12
Percentage increase in demand
2020-2040 over 1990-2010
Infrastructure
2.5
planning
2
Pricing
1.5
1
0.5
0
CCCMA3.1
CSIRO-MK 3.0
ECHAM5
MIROC3.2
-0.5
DS 1
DS 2
DS 3
29/08/2019
13
Percentage increase in demand
2060-2080 over 1990-2010
5
Infrastructure
planning
4.5
4
3.5
Pricing
3
2.5
2
1.5
1
0.5
0
CCCMA3.1
CSIRO-MK 3.0
ECHAM5
MIROC3.2
DS 1
DS 2
DS 3
29/08/2019
14


The impact
Infrastructure development in Sydney
should plan for a marginal increase of;
•
2.23% (in 2020-2040),
•
4.4% (in 2060-2080),
In demand for water, due to climate change
29/08/2019
15
Document Outline