 ProjectionsofwaterdemandusingNARCLiM
BuildingonworkfundedbySydneyWater,UNSWhasnowusedNARCLiM
simulationstoexaminechangesinwaterdemandthroughto2020-2040.
Thisusesourstochasticweathergenerator,butfeedssimulatedpseudo-weather
sourcedfromtheNARCLiMsimulations.Thisprovidesanensembleof
projectionsforwaterdemandduetotheusebyNARCLiMoffourglobalclimate
models,eachdownscaledwiththreevarietiesoftheWeatherResearch
Forecasting(WRF)model.TheNARCLiMdatausedisidenticaltothatprovided
byNSWOEHandthusthefollowingisconsistentwiththoseproductsbeingused
widelyoverNSW.
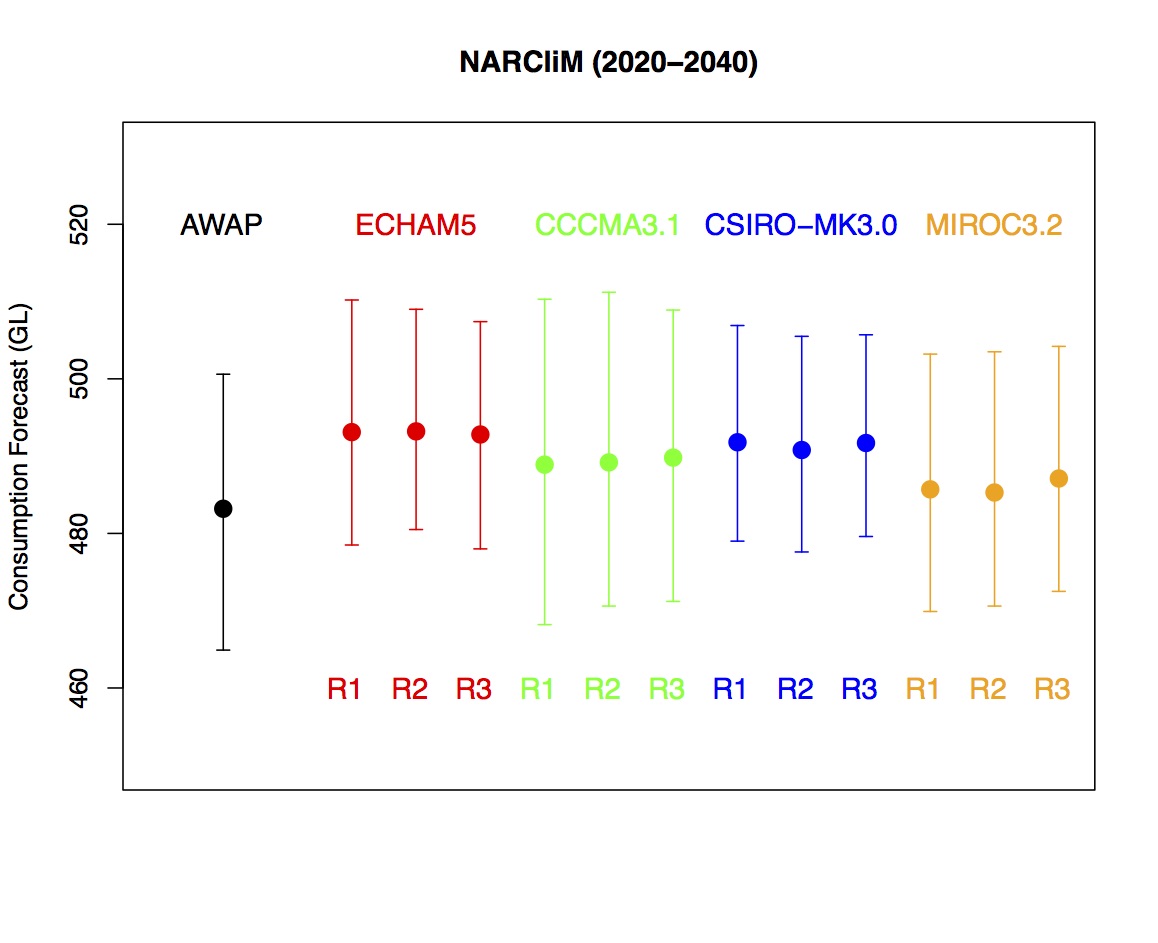
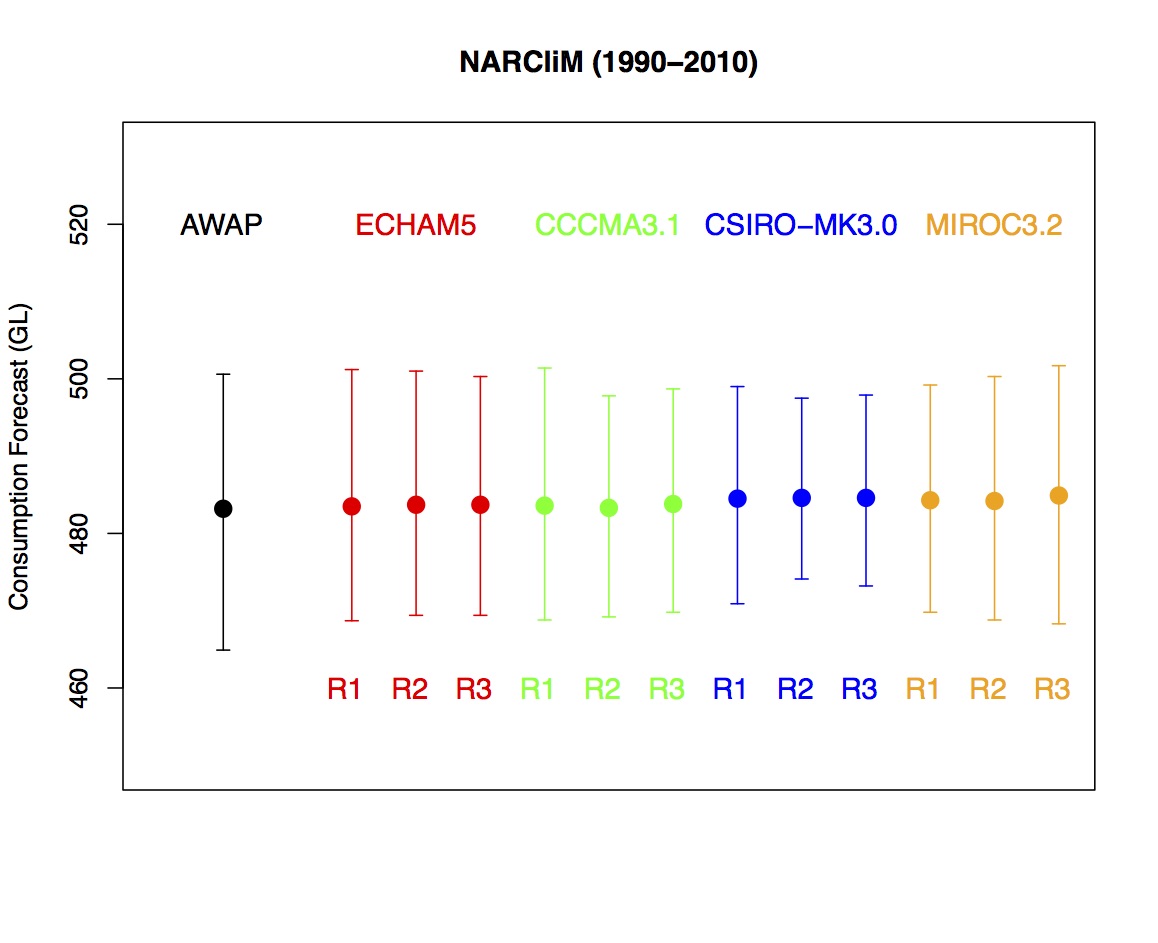
Figure1ashowstheforecastconsumptionusingNARCLiMfor1990-2010.Each
barprovidesthemedianandrangeinestimatedconsumptionfrom100weather
scenarios.Thiscanbecomparedtoestimatedconsumptionover2020-2040
(Figure1b)assumingnochangeinpopulation–thechangefromFigure1ato1b
onlyreflectstheimpactofchangesintheweatherassociatedwithachangein
climate.
Figure1breflectsanincreaseinconsumption(2020-2040)oftypically0-2%
relativeto1990-2010.Thechangeinconsumptionisinsensitivetotheensemble
member(R1,R2,R3)butissensitivetothechoiceofclimatemodelusedto
providetheforcingboundaryconditionsfortheWRFdownscaling.Atthelowest,
andfocusedonthemedian,MIROCforecastsincreasingdemandof0.23-0.45%.
Atthehighest,ECHAMforecastsincreasingdemandof1.88-1.99%.Note,CCCMA
forecastsarangewhichincludesboththehighestandthelowestestimatesand
mightthereforebeagoodchoiceofmodelifchoosingoneforfuturepurposes.
Figure1.Waterconsumptionforecastfor(a)1990-2010(left)and(b)2020-2040)
right.
Wecanisolatetheimpactofchangingextremesonforecastconsumption.Figure
2ashowstherelationshipbetweennumberofdaysover30oCandconsumption.
Thereddots(1990-2010)areallbelowanydotfor2020-2040(bluedots).This
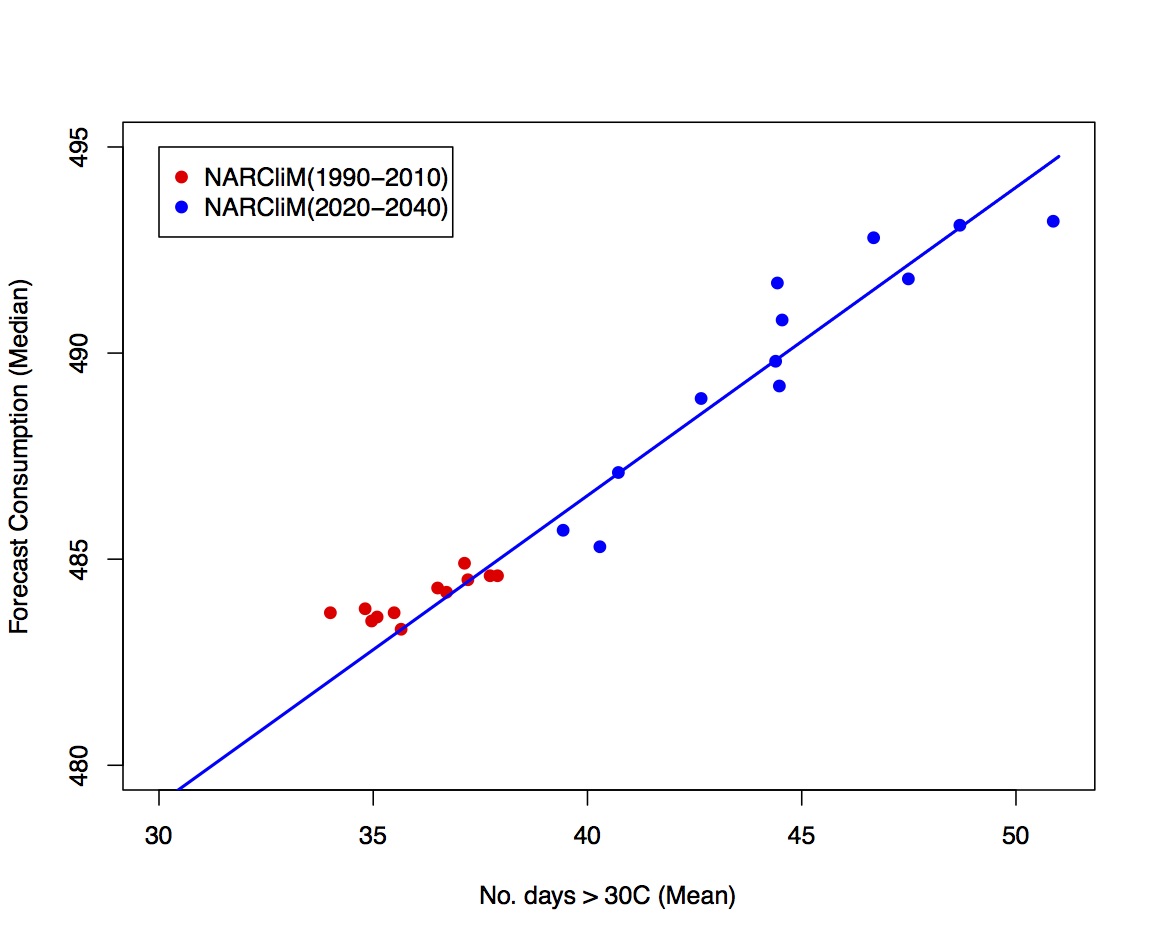
iscausedbyincreasingfrequencyofdaysover30oCwhichisaprojection
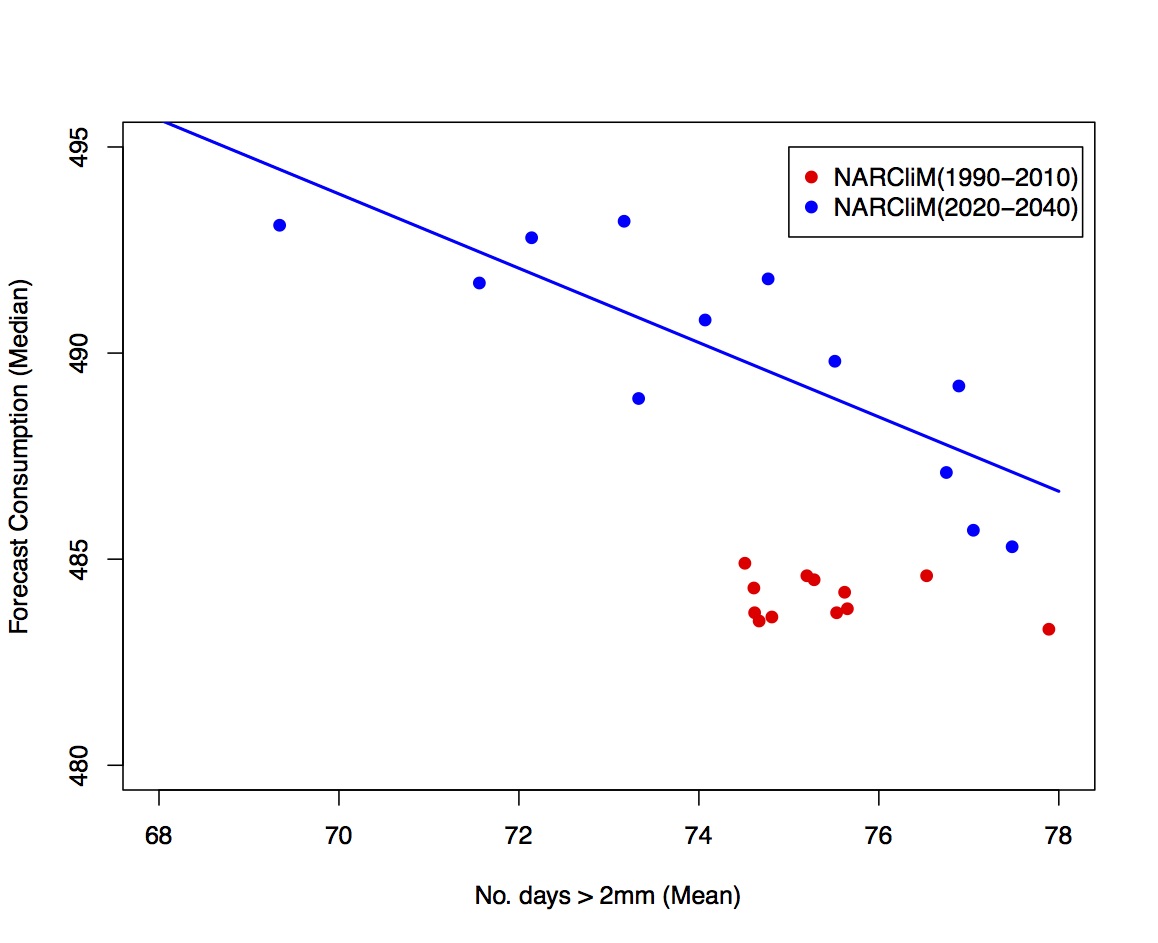
consistentwithmanypreviousstudies.Figure2bshowsthechangeinthe
numberofdayswithmorethan2mmofrainfall.Heretheimpactislessobvious
withsomemodelsforecastinglittlechange,andotherssuggestedaslight
decrease.Again,thisisconsistentwithpreviousstudiesthatchangesinrainfall
arelesscertainthanchangesinrainfall.
Figure2.Waterconsumptionforecastfordependingonnumberofdaysover30C
(left)and(b)onnumberofdayswithover2mmofrainfallright.Reddotsarefor
1990-2010,bluedotsarefor2030-2040.WearecurrentlyextendingthisanalysistoincludetheNARCLiM2070-90
period.Thismightberelativelystraightforward,butitisalsopossiblethatthe
changesby2070-90movetheclimatetoastatethatispoorlycapturedbythe
existingweathergenerator.Thiswouldrequiresignificantadditionalwork.